
Throughput Accounting vs. Product Costing
- Gianluca Davico

- Feb 13, 2020
- 8 min read
Updated: Feb 17, 2020
Product Costing: Is It A Policy Constraint?
After showing the bias of Inventory and having discussed how throughput accounting proposes a different approach to measure Profitability, let’s work out another important bias of traditional accounting in measuring local performance: Product Costing.
Why Companies Makes Use Of Product Costing
Product Costing has been developed with the scope of serving several purposes:
to determine the expected cost of the product to be used in pricing decisions;
to use the cost of the product as a measurement of production efficiency;
to evaluate make-or-buy decisions;
to rank products by profitability and used by Marketing for product-mix decisions;
and many other uses.
According to the manufacturing process types, many techniques can be applied:
job costing, primarily adopted in manufacturing environments organizing the production flow in lots and batches;
process costing, adopted in those manufacturing environments producing with continuous flow of undetermined products.
Full Costing In Job-Shop Environments
Let's take in consideration the most common application of product costing. Job costing with full cost technique is the most adopted within industrial manufacturers working lots or batch of products, typical of job-shop manufacturing environments.
Based on product costing principles, traditional accounting allocates to each product the following components
Direct materials: the quantities of materials used to make a product, corrected by a yield factor. This means that if a product has a yield of 90% and the quantity of material in a "good product" cost €50 per piece, the standard material cost will be € 55,5 per piece, to account for the 10% of products that will be scrapped.
Direct labor: the quantities of labor hours it takes to produce a product times the hourly labor rate for the resource that worked on the product. The quantity of time a product absorbs from a work center is called operational time and it is made of:
Set-up time: the time it takes from the exit of the last good piece of the previous batch to the exit of the first good piece of the current batch. It is the time employed to change the tooling, calibration, tune the work center, test in order to have the first good piece of the batch.
Run-time: it is the processing time that each item absorbs at the work center from the time it enters till it exits the processing stage.
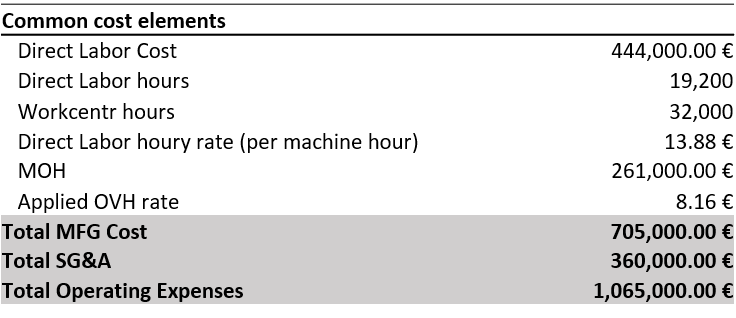
Manufacturing overhead (MOH): they are determined applying to products a rate that, for each hour of operational time absorbed by the product, allocate a certain amount of overhead costs to the product. If MOH are applied for each machine hours (machine intensive productions), the hourly rate is defined dividing the total indirect overhead by the total machine hours available; if MOH is applied for each labor hours absorbed by the product (labor intensive productions), the hourly rate is determined dividing the total indirect overhead by the total labor hours available.

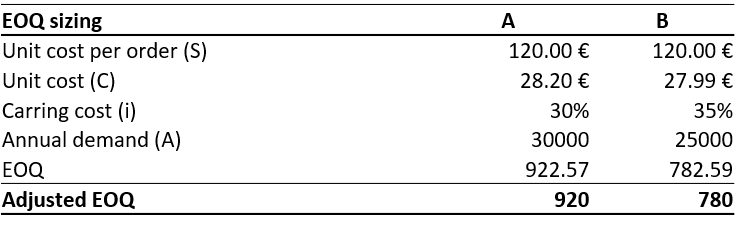
As the incidence of set-up costs on each product depends on the lot size, in standard costing this cost is calculated considering the EOQ (Economic Order Quantity) size of a batch.
The EOQ is determined at the intersection of the carrying cost and the ordering cost curves and minimizes the total costs curve.

Known:
the annual demand (A)
the average ordering cost (S)
the unit product cost (c)
and the carrying cost rate (i)
the formula determines the quantities of the intersection of the ordering and carrying cost curves to minimize the total costs.
As we like to be pragmatics, let's start building our use case with the following data.
And let's consider the following cost data, where we have calculated the hourly rates based on the available work center hours to simplify (each work center has the same machines, with the same performance and requires the same amount of labor).
From work center file and routings file we get the information of the amount of set-up and run time needed by each product at each work center and the available time of the work center (data in minutes).

Finally we have the remaining product data, informing about the annual demand volumes and average monthly consumption, the unit sale price and the direct material cost per unit.

We have now all the elements to determine the standard product cost for the EOQ batch size
An EOQ batch of product A (920 Q) requires
2 hours of set up at WC1 and 184 hours of run time
3 hours of set up at WC2 and 153 hours of run time
An EOQ batch of product B (780 Q) requires
2 hours of set up at WC1 and 260 hours of run time
3 hours of set up at WC2 and 195 hours of run time
Considering direct materials, the cost of an EOQ batch is the following:

And dividing per the quantities of the batch we will get the Unit Standard Cost of each Product A and B.

The reader should now have some questions:
how much the probability that the factory will produce all the lots always with the same batch size? The answer is zero, because times to times (very often) there will be the need to split the lot for instance to expedite one order, or because due to some missing parts, i cannot place the entire lot in production for instance
how much the probability that i will produce exactly the same volumes planned? Zero again, because the actual demand will be always different from the budgeted one that has been used to determine the hourly rates employed for the math.
All these fluctuations will then cause variances that will determine variations in the actual efficiency compared to the standard planned.
These variances are the KPIs which most production managers are typically measured against.
Let's Play With Batch Size
Looking at the EOQ data, it’s quite evident that such long batches of 150+ hours determined with the EOQ principles are quite unpractical and, although economically efficient, they will cause a lot of problems:
very long lead times caused both by long runs and by very long queues and waiting times for each batch to finish,
a huge amount of WIP in the system.
Let’s say that applying TOC principles, we decide to drastically reduce batch size setting them up to a much smaller size to improve the flow.
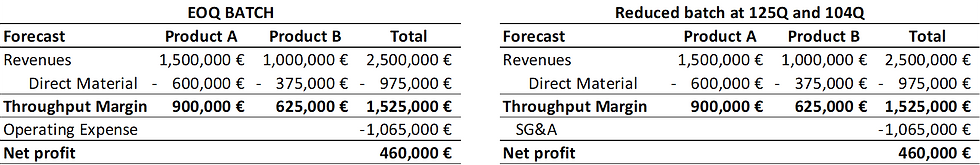
Let’s assume a batch of 125Q for product A and 104Q for product B and let’s run the data again.

Looking at the data, it seems that the change of strategy in batch size is penalizing in term of an increase of product cost respectively of +2,7% on product A and +3,3% on product B.
If a production manager has his bonuses linked to this kind of cost efficiency parameter, he would think twice before reducing the lot size, despite all the benefits it creates.
But let’s look on the effect of the stock of such different lot sizes
The stock profile with lot size 920Q and lot size 125Q (assuming for both a constant daily average demand of 83 units) would look like the graphs below.

With lot size at 920Q:
Manufacturing lead times are very ong. Starting from 5 days of operational time (set-up and run) we added 8 days of queue and wait (queue and wait time is generally the biggest portion, acounting for 60% to 90% of total lead time) for a total of 13 days.
Considering DDLT, reorder point is set at 1200Q with a safety stock of 2 days at 166Q
With lot size at 125Q:
Lead times are 60% shorter. We assumed 5 days: 2 of operational time + 3 days of queue and move
Considering DDLT reorder point is set at 282Q with a safety stock again of 2 days at 166Q
Without running any math, just comparing the two stock profile it is evident that in case of EOQ the average Finished Good inventory is times much higher and since lead times are longer, also the amount of WIP will be much higher.
Summarizing, we've got the following situation:

Considering both Product A and B we get the following P&L comparison using EOQ batch or the reduced batch size tuned at 125Q for Product A and 104Q for Product B.

The cumulative impact is €45,791 loss of net profit equal to a 8% of overall negative variance on net profit.
Someone may argue that the decision of reducing the lot size was a bad decision, because it caused more set-up with the cost of each spreading over a fewer numbers of products in each batch. But we shall not stop at these first evidences, and we shall deep dive more to find what is wrong here.
Let's think for a while.
In order to reduce the lot size, we have caused more set-up to happen.
More set up have requested more time of workers to execute the set up.
But one moment: have we incremented the capacity to execute more set up?
Let's have a look.
Working with batch size at 125Q for Product A and at 104Q for product B we are:
using 916,800 minutes at WC1, out of 960,000 minutes of capacity available
using 760,800 minutes at WC2, out of same available capacity of 960,000 minutes
To manage the new batches we have definitely not changed the capacity, nor asked for overtime nor added any shift. So the total cost we have incurred in reality didn't change and we have paid the same number of labor hours in both cases.
So how is it possible that the product cost has been increased? Let’s see what happens if we use Throughput Accounting.
Absolutely nothing happened. As it is right to be.
As both with EOQ and with smaller batch size we didn't have to increase the capacity, Throughput Accounting has provided the same results in both cases. We would have seen a difference only in case to execute the additional set-up we had to hire additional workers, or to add shifts or to use overtime.
The advantage of Throughput Accounting is now fully evident: it removes distortions of traditional accounting measures that acts as a policy constraint to the management that aims to improve operations by reducing lot sizes and lead times to provide better service level and at the same time reducing inventories.
We shall also argue that, reducing the lot size and providing a better service level to customers (because I can quote them shorter lead times) the action of reducing the batch will also help marketing winning more sales.
A last remark. Why a difference in the net profit between traditional accounting and Throughput Accounting?
It is due to the labor and MOH variances:
Using the standard EOQ batches, production volumes will absorb 25,904 standard manufacturing hours, against a total capacity used to determine the rates of 32,000 hours.
The hours not absorbed to products shall be accounted to the P&L as variances due to lower absorptions of costs (or to inventory accounts if a portion of the item remains unsold).
Another additional complication that doesn’t help at all making clarity and creating additional constraints for a straight-forward management of the company.
Conclusions
It's difficult to argue against reduction of lead times and lot-sizes: it is absolutely a beneficial action.
It helps providing a better customer service level (faster response and reaction times).
It provides greater agility to supply chain to react to demand fluctuations.
It lowers the amount of Finished goods inventory.
It lowers the amount of WIP (because queues and wait time are shorter).
It create benefits for our customers as they can rely on a more flexible supply chain.
It helps marketing winning more deals, as they can quote customers shorter lead times and expose the advantage above.
It reduces forecast dependency, allowing production to rely more on effective customer orders.
Removing forecast dependency over longer periods, it increases forecast accuracy.
To enable these actions properly, organizations should seriously evaluate to change their management accounting system from traditional accounting to throughput accounting, in order to remove all the burden and policies constraints preventing production managers to pursue such kind of improvement actions that are greatly beneficial for the Company as a whole.
Accounting and measurement system should not be a constraint preventing improvement behavior.
The reason why traditional accunting is a constraint it is because its foundations are based on wrong assumptions:
the assumption that fixed cost may be treated as variable to be allocated to products. Fixed costs are fixed and are triggered at the moment i decide to buy a certain capacity. Product costing has to do how i use such capacity, and any attempt to treat those costs as variable will generate in any case bias.
the assumption that time = cost. Time is time. Cost is cost.
the matching principle attempting to match costs at the moment that revenues are generated. The two moments are well separated in time: generally, we incurr the cost first to buy / borrow the capacity needed, then we use such capacity to produce the products or service we intend to sell, then we hopefully get the revenues when those products or services are sold. The mechanism of product costing, trying to suspend costs and match them when revenues occur, is a nice attempt, but it has nothing to do with reality. Being a sophistication of reality, as any distortion, it causes bias when this distorted representation of facts is used to promote human behavior.

If you think is it worth to implement Throughput Accounting for your management accounting system we, at WeeonD, are experts in Theory of Constraints, and we help companies quickly implement Throughput Accounting models.
To learn more, please contact us via our website (www.weeond.com/contacts) or by email at info@weeond.com


Comments