
Throughput Accounting - Profitability Analysis
- Gianluca Davico

- Dec 11, 2019
- 7 min read
Updated: Feb 11, 2020

This post continues the story started in the previous blog, which tells the story of two fictitious and completely identical companies, to explain how they get substantially different results depending on whether they adopt the Theory of Constraints accounting model - Throughput Accounting – or a Traditional Accounting model based on Full Costing logic.
We analyzed the different priorities of the two accounting systems and the distortions involved in stock valuations and their impact on the income statement.
Now we will see how Profitability Analysis are also different, and how Throughput Accounting logic is again superior than the traditional one.
Throughput Accounting and Theory of Constraints for Profitability Analysis
We remember that:
TR Company uses traditional accounting based on full manufacturing costs
TA Company uses Throughput Accounting
We had left our TR Company Controller confused to reflect on the poor outcomes after the Annual Business Review.
Meanwhile, year 4 is about to begin: both companies have prepared their Budgets, which for convenience we keep constant compared to previous years.
Below is the Budgeted Production Plan which for convenience we have assumed being leveled for each Quarter.

Below we remind you of the basic data that will be used in the course of the case study
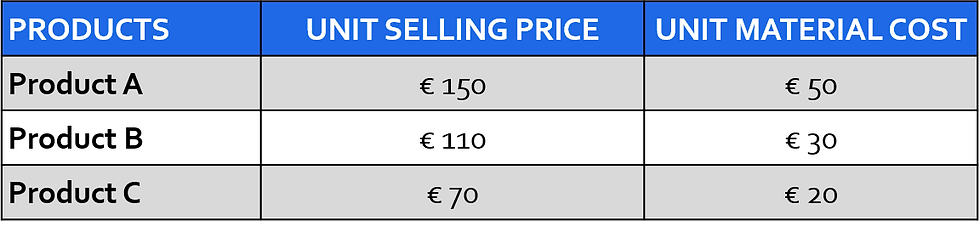
And the cost drivers connected to the level of capacity that are equal for each company as well and that we have not changed from previous years.

Just before the start of the new Fiscal Year, the Sales & Operations Plan for the first Quarter is drawn up, with the orders already collected and the new forecast.
From the demand management data, it immediately appears that, compared to the Budget approved just over a month earlier, the new S&OP results in a Master Production Schedule significantly greater than budgeted, due to the acquisition of a new customer who has signed a scheduling agreement with significant additional quantities in forecast for Product A

From an initial assessment, it can be seen that there may be capacity issues to meet the demand and produce the resulting Master Production Schedule (MPS), and therefore a precise analysis of Capacity and Load is carried out.
The analysis shows that Workcenter WC11 has become a Constraint, as the load that would be placed on it to produce the plan exceeds significantly the available capacity by 331 hours.
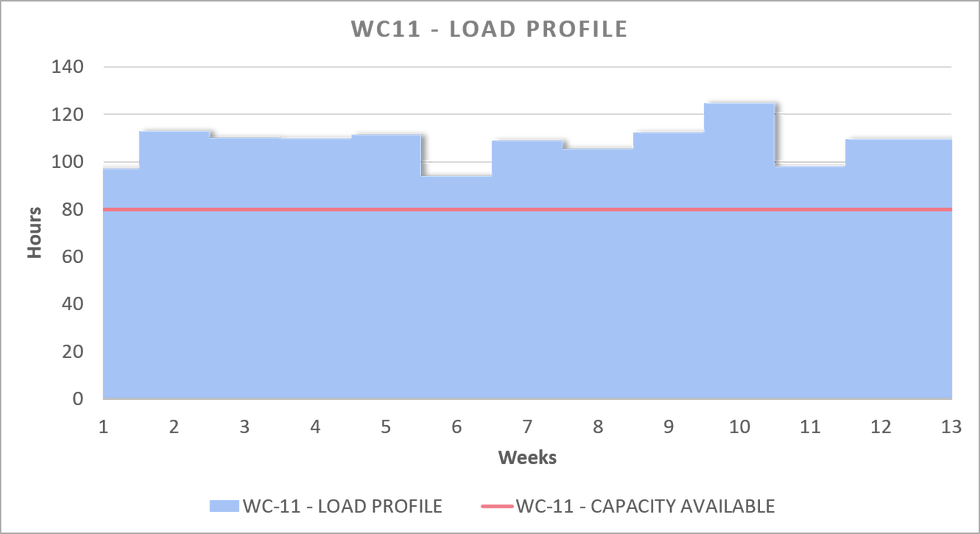
The analysis confirms also that the other work centers do not have capacity problems.
Let us assume that it is not possible to increase the number of shifts, nor to use overtime or subcontracting: the only available option is to decide how to level the MPS to bring it back into the alleys of available capacity.
At this point let's see how the management of the two companies reacts differently as supported from their respective accounting models. Both controllers run a profitability analysis.
Profitability analysis with traditional Full Manufacturing Costing Model
The controller of the TR Company will try to identify and push the products that guarantee a higher gross profit. Based on traditional accounting data, the following ranking is made.
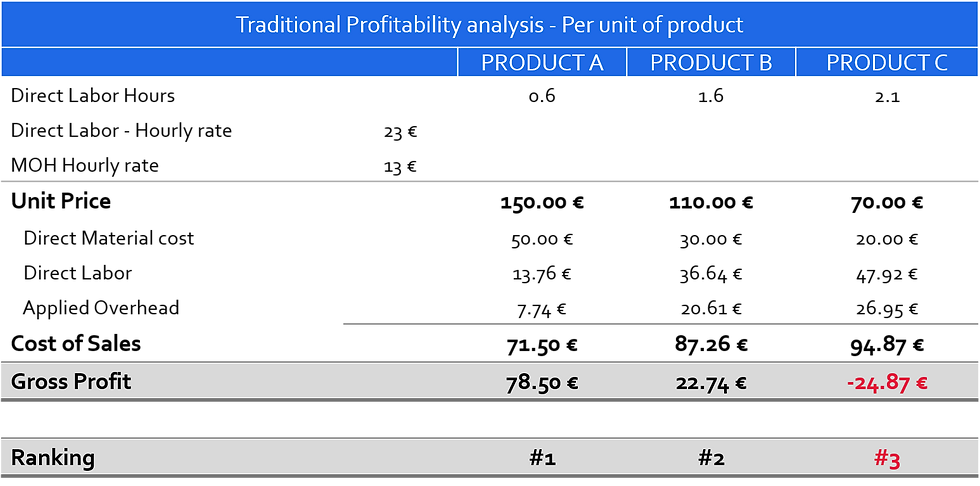
Based on this ranking, the management agrees with the proposal of the controller and decides for a new MPS which eliminates Product C from the plan and therefore favors Products A and B.
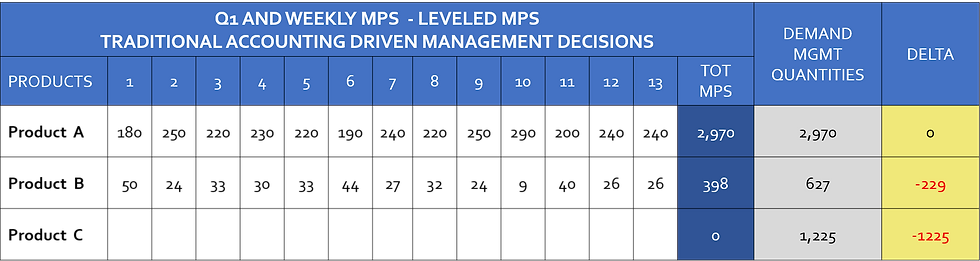
The new MPS completely satisfies the production of the 2970 units in demand of Product A; for Product B, compared to the 627 in demand, only 398 units can be produced. Production of product C is completely zeroed.
The load on the WC 11 constraint is levelled out and the MPS is thus approved.

The fine tuning of the leveling will be done with the job scheduling, but it is evident that the plan can be achieved.
Let's now have a look to the economic results achieved with this MPS plan for the first 3 months by TR Company. To avoid further complications, we assume that all the production carried out is actually sold, without affecting the inventory previously accumulated.

The income statement at the end of the first Quarter is satisfactory: a pre-tax profit of €114,340 was reported. However, the income statement shows variances both for Direct Labor of €49,092 and for Manufacturing Overheads of €27.614.
These variances are due to a volume effect: in fact, the direct labor hours produced are only 2.427, against a plan that was intended to develop 4.598 hours of hours produced.
This lower absorption (the hours are absorbed to products according to the budget rates) must be expensed to the income statement as variance, since they cannot be assigned to Inventories, that by the way have not been increased, as can be verified from the Balance Sheet, which reports the same level of inventory at the end of year 3 (for verification see the previous post).
Can one do better than that? The answer of course is yes.
Throughput Accounting Profitability Analysis
Let's see now what different decisions have been made by TA Company pushed by Throughput Accounting and the logics of the Theory of Constraints, TA. Let's try also to understand why Throughput Accounting led TA Company making so different decisions.
Let's look again for a while to the reasoning done by TR Company's Controller: looking at the data he had in hands, it would seem that zeroing the production of Product C, since it has a negative margin, is the right choice to do. What other decision could the controller have made?
Let's see now what decisions TA Company’s S&OP team will take supported by the Theory of Constraints and Throughput Accounting.
This management philosophy adopts a completely different approach for profitability analysis, a path that proves to be successful again.
We remember that the priority of the Theory of Constraints and Throughput Accounting is Maximizing Throughput, and we remember that Throughput does not consider the conversions costs that are allocated to products.
So, what is this logic and how to rank the various products to maximize throughput?
Simple: the path is to Maximize Throughput for every second used at the constraint. Therefore, the products are classified according to how long they stay and lock the constraint.
The formula for maximizing throughput is as follows:

In other words, we shall identify, for each product, how much work they absorb at the constraint in the transformation process and divide their throughput to achieve throughput per unit of time.
Let's remember that the Unit Throughput Margin is given by the difference between the Selling Price and Truly Variable Costs (that in the example we assume to be only the direct materials, but can include for example freights and sales commissions also).
Here how TA Company ranked its Products in terms of profitability.
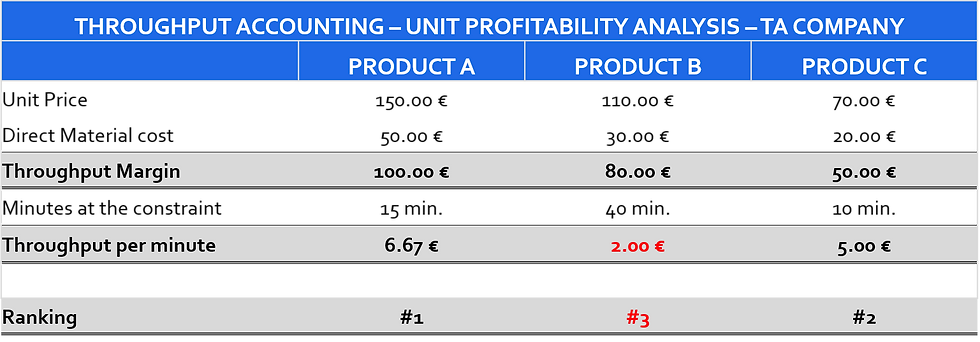
According to Traditional Full Costing model Product B was better than Product C in term of profitability. Product C has been ranked 3rd and thus dropped down from the production plan as a generator of a negative gross profit,
With Throughput Accounting Profitability Analysis and measuring the Throughput Margin per unit of time at the Constraint, the results have completely turned the other way around:
Trusting these data, TA Company develops a different MPS:

The plan provides for the entire demand for product A with 2970 units and for product C with 1225 units to be met. There is no further capability available for product B as the constraint is fully loaded.

Let's now analyze the economic result at the end of the 13 weeks of Q1: for convenience and linearity of comparison, we maintain the same sales performance of Company TR, i.e. the entire MPS is sold and there is no increase in inventories.

Once again, TA's choices with Throughput Accounting have been rewarded: with the different decisions taken, aiming to maximize the throughput for each minute of use of the constraint, it closed the quarter with a profit before taxes of € 143,750, while the TR company that chose a different mix according to the indications of the traditional accounting, stopped at € 114,340, with a difference of € 29,410, equal to 26% more profit.
Such a different result is not due to accounting principles, as we deliberately assumed sales equal to production in order not to create distortions due to changes in inventory: both companies reported the same Operating Expenses for €214,500 in the income statement - although under different accounting records: as Operating expenses for the TA Company
while reclassified for TR Company as:
€85,794 allocated to the products (€54,908 as Direct Labor and €30,886 as MOH)
€76,706 as variances
€52,000 as SG&A
Conclusions
In those two blogs (see also previous one) we have discussed, with practical examples and data, around superiority of Throughput Accounting, compared to traditional Full Costing accounting logic.
Summarizing the outcomes let’s highlights all the advantages we have identified:
It surpasses the distortions of full costing methods, as it does not suspend conversion costs in inventories and that full costing method treats as variable costs despite, in reality, they are fixed costs as they depend on decisions made on capacity that cannot be changed in the short term
It focuses on managing just buffer inventories to minimize risks connected to the constraints, while it discourages the creation of surplus inventories, aligning to all management best practices (Lean, TQM and so on)
It focuses management decisions on maximizing the throughput and thus the value generated for each unit of time of utilization of the scarcest resource: the constraint. In this way it maximizes the entire system throughput.
It links accounting to operations, introducing a simple to understand accounting logic that does not generate confusion
It is quick and easy to adopt, as it avoids all complicated burden of cost absorption processes and measurements.

If you think is it worth to implement Throughput Accounting for your management accounting we, at WeeonD, are experts in Theory of Constraints, and we help companies quickly implement Throughput Accounting models.
To learn more, please contact us via our website (www.weeond.com/contacts) or by email at info@weeond.com


Comments